
Summary
The blog code repo can be found here
I was recently asked to do a talk for the Network Programmability and automation Meetup related to all things observability. In my day job I field many questions and tend to see a lot of different gNMI setups with different technologies. The two I tend to see the most are Telegraf and gNMIC. I could contrast the two of them but my personal preference is generally gNMIC. There are many reasons for gNMIC but its robust processors, outputs, rest api, go module and ability to do gNMI tunnels make it my choice plus its owned by the openconfig group. Overall, the biggest reason for me is the fact that you can have a gNMIC cluster with a rest API on top of it that can control the entire environment. Plus, if one of the cluster members tends to have issues or you needs to upgrade it you will not see a loss in your observability. This for me makes gNMIC really awesome.
So that being said I wanted to blog about using gNMIC as a production level collector a lot of my talk will be related to gNMIC as well as gNMI overall. I find it extremely valuable that anyone can get started on this with such a low barrier in test only with containerlab ceos or other NOS vendors and you are ready for testing. The maintainers who created and keep this project going are the real MVP’s. I cannot stress enough that gNMI has gained so much traction over the past few years because of all of their hard work.
gNMIC Infra 1000ft view
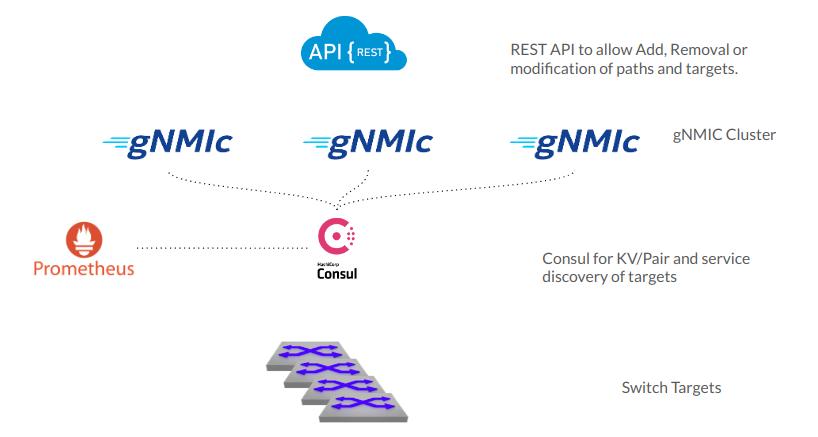
Starting from the top.
There is a rest API on top of gNMIC. I have it as a single instance. However, every gNMIC device simply runs a rest API on the default port of 7890. This is a configuration knob of course.
gNMIC in the middle is where most of the action happens. gNMIC will share the load of their targets. So it in my case all of the dial out functionality with gNMI to connect for each target to subscribe to their gNMI service. I am pulling simple interface stats for each cEOS container.
Consul is what does all of the service discovery. Consul is probably a newer mechanism for most network engineers. The tool itself is from Hashicorp. It allows services to register themselves and discover other services as well. In this case gNMIC will register itself with its DNS/IP as well as its port for the clustering. Same goes with the Key value pairs for each target. Prometheus also talks to consul to discover its dynamic gNMIC targets to scrape.
Prometheus is there to do all of the scraping of metrics. Each gNMIC container is a prometheus exporter. Meaning it will take in gNMI data and then export the gNMI data as prometheus metrics on its default port os 9804.
You can then tie in grafana if you would like to create dashboard on this sort of thing.
Lab time with explanation!
Start the lab
containerlab -t cluster.yaml deploy --reconfigure
+---+---------------------------+--------------+---------------------------------+-------+---------+----------------+----------------------+
| # |           Name            | Container ID |              Image              | Kind  |  State  |  IPv4 Address  |     IPv6 Address     |
+---+---------------------------+--------------+---------------------------------+-------+---------+----------------+----------------------+
| 1 | clab-cluster-ceos1        | 2913d9213741 | ceoslab:4.31.0F                 | ceos  | running | 172.20.20.2/24 | 2001:172:20:20::4/64 |
| 2 | clab-cluster-ceos2        | 115f613e268b | ceoslab:4.31.0F                 | ceos  | running | 172.20.20.3/24 | 2001:172:20:20::3/64 |
| 3 | clab-cluster-ceos3        | f4e60ef37ba1 | ceoslab:4.31.0F                 | ceos  | running | 172.20.20.4/24 | 2001:172:20:20::2/64 |
| 4 | clab-cluster-consul-agent | d56e23b8efb8 | consul:latest                   | linux | running | 172.20.20.9/24 | 2001:172:20:20::9/64 |
| 5 | clab-cluster-gnmic1       | 5752de2c94a2 | ghcr.io/openconfig/gnmic:latest | linux | running | 172.20.20.7/24 | 2001:172:20:20::7/64 |
| 6 | clab-cluster-gnmic2       | 97133f16a70c | ghcr.io/openconfig/gnmic:latest | linux | running | 172.20.20.5/24 | 2001:172:20:20::5/64 |
| 7 | clab-cluster-gnmic3       | de0355067ba8 | ghcr.io/openconfig/gnmic:latest | linux | running | 172.20.20.6/24 | 2001:172:20:20::6/64 |
| 8 | clab-cluster-prometheus   | 01fbe9f88c0e | prom/prometheus:latest          | linux | running | 172.20.20.8/24 | 2001:172:20:20::8/64 |
+---+---------------------------+--------------+---------------------------------+-------+---------+----------------+----------------------+
I will explain as much as I can with the lab structure what each file does.
Once again from https://github.com/burnyd/Telemetry-Meetup-2024 repo.
➜  Telemetry-Meetup-2024 git:(main) ls -l | grep yaml
-rw-rw-r--  1 burnyd burnyd 3119 Mar 22 11:45 cluster.yaml
-rw-rw-r--  1 burnyd burnyd 1412 Mar 22 11:45 gnmic.yaml
-rw-rw-r--  1 burnyd burnyd  153 Mar 22 11:45 targets-config.yaml
cluster.yaml - No need to go too into this file as this is the containerlab yaml file to create the environment. gnmic.yaml For space sake I will go over the portions which maybe confusing or new to others.
loader:
  type: file
  # path to the file
  path: ./app/targets-config.yaml
  # watch interval at which the file```
  # is read again to determine if a target was added or deleted.
  interval: 30s
  # if true, registers fileLoader prometheus metrics with the provided
  # prometheus registry
  enable-metrics: false
gNMIC has loaders which simply tell gNMIC on startup how to reach targets. I am loading from the targets-config.yaml which is really simplistic says the two different ceos pods are first. This is not needed I could have leveraged the rest api for this as well.
clustering:
  cluster-name: cluster
  targets-watch-timer: 30s
  locker:
    type: consul
    address: clab-cluster-consul-agent:8500

outputs:
    simple-prom:
      type: prometheus
      service-registration:
        address: clab-cluster-consul-agent:8500
For each gNMIC container it will talk to the consul agent. For each gnmic container it will also expose its metrics for prometheus on port 9804 the default as well as register itself to consul.
And other files to note are the prometheus/prometheus.yaml file. Which simply tells prometheus which targets to scrape.
A look into consul services.
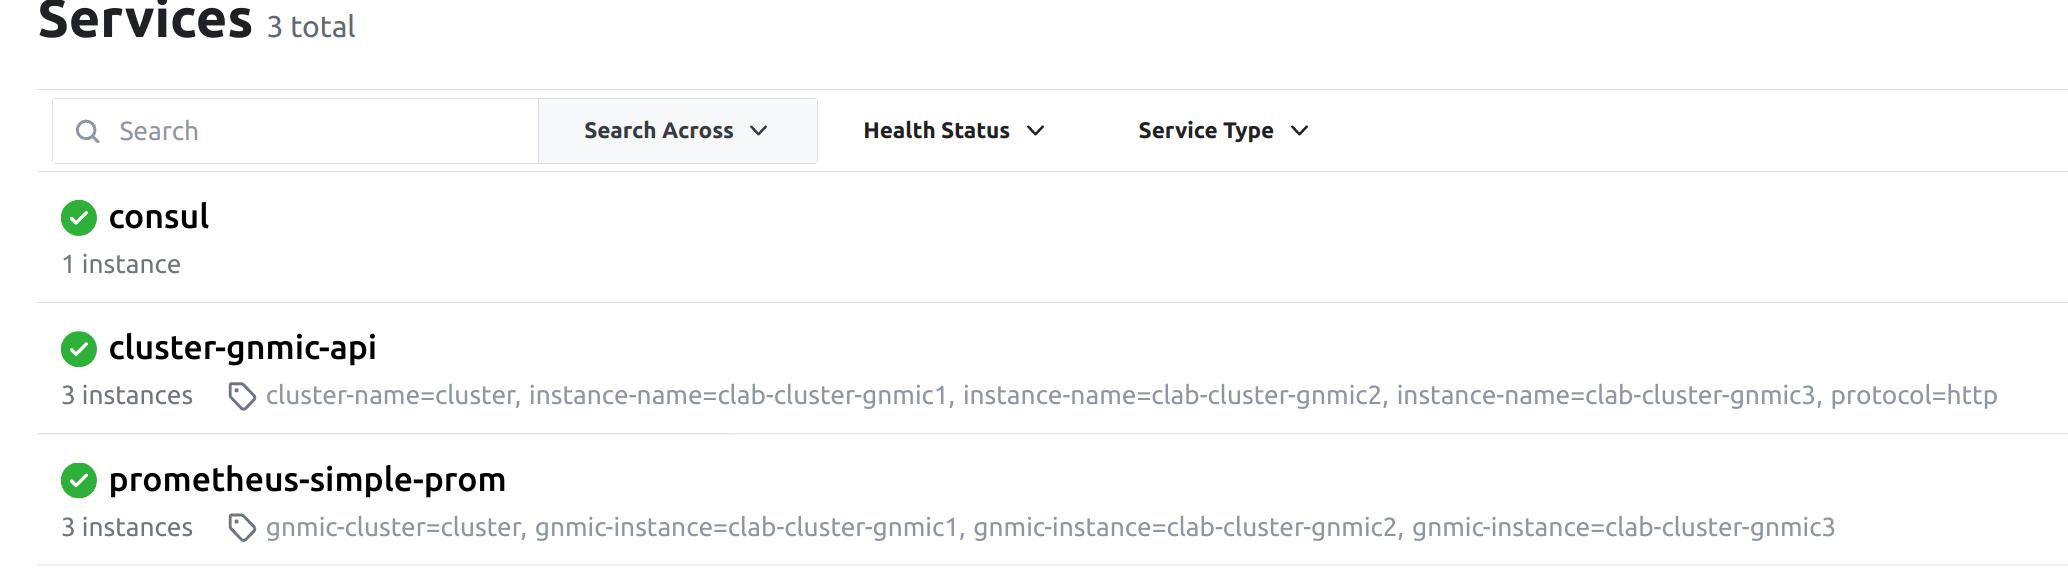
We can see the two services here that we care about.
cluster-gnmic-api -> This is how each gnmic containers discovers each other and has K/V pairs for targets. prometheus-simple-prom -> This is how prometheus will know which gnmic containers to scrape for metrics.
Using the API
So putting this all together we have a gNMIC cluster that has a K/V backend with consul for service discovery as well. So if we lose a gNMIC container that is okay or if we have to perform an upgrade or possibly new subcriptions this will all keep humming a long just fine.
The API will allow for us to perform most CRUD operations against gNMIC. As a quick disclaimer you need to find the leader of the cluster before talking to the API. Which itself you can ask any of the gNMIC devices or even leverage consul to find this.
I have examples of how to get this in both the go binary I put togethere within the repo. As well as seperate curl results just to show how flexible it is.
Curl examples
Find all the containers names IPs if its not within DNS this is optional.
export GNMICAPI1=$(docker inspect -f '{{range .NetworkSettings.Networks}}{{.IPAddress}}{{end}}' clab-cluster-gnmic1)
export GNMICAPI2=$(docker inspect -f '{{range .NetworkSettings.Networks}}{{.IPAddress}}{{end}}' clab-cluster-gnmic2)
export GNMICAPI3=$(docker inspect -f '{{range .NetworkSettings.Networks}}{{.IPAddress}}{{end}}' clab-cluster-gnmic3)
Find the leader this is related to clustering. The leader has all the information due to the way gnmic uses sharding and consul. So all API interaction needs to leverage the leader. More about this can be found on the clustering portion of the gnmic docs here.
curl --request GET $GNMICAPI1:7890/api/v1/cluster | jq .leader
For example the response from this will be in my case any of the random gnmic docker containers.
"clab-cluster-gnmic1"
So all communication will be through clab-cluster-gnmic1 at this point.
Find all the targets.
curl –request GET $GNMICAPI1:7890/api/v1/config/targets | jq .
{
  "172.20.20.2:6030": {
    "name": "172.20.20.2:6030",
    "address": "172.20.20.2:6030",
    "username": "admin",
    "password": "admin",
    "timeout": 10000000000,
    "insecure": true,
    "skip-verify": true,
    "buffer-size": 100,
    "retry-timer": 10000000000,
    "log-tls-secret": false,
    "gzip": false,
    "token": ""
  },
  "172.20.20.3:6030": {
    "name": "172.20.20.3:6030",
    "address": "172.20.20.3:6030",
    "username": "admin",
    "password": "admin",
    "timeout": 10000000000,
    "insecure": true,
    "skip-verify": true,
    "buffer-size": 100,
    "retry-timer": 10000000000,
    "log-tls-secret": false,
    "gzip": false,
    "token": ""
  }
}
Find all the subscriptions
curl --request GET $GNMICAPI1:7890/api/v1/config/subscriptions | jq .
Add a target
curl -X POST -H "Content-Type: application/json" -d ' {"name":"172.20.20.4:6030","address":"172.20.20.4:6030","username":"admin","password":"admin","insecure": true}' $GNMICAPI1:7890/api/v1/config/targets
Delete a target
curl -X DELETE -H "Content-Type: application/json" $GNMICAPI1:7890/api/v1/config/targets/172.20.20.4:6030
Build the binary optional
This is a small go based binary I put together to act like a CLI which does the same thing fwiw.
go build -o bin/cli main.go && cd cli/bin
./cli -findleader
http://clab-cluster-gnmic1:7890
Get the targets.
./cli -gnmicapi http://clab-cluster-gnmic1:7890 -gettargets
[172.20.20.2:6030 172.20.20.3:6030]
Get the subscriptions.
./cli -gnmicapi http://clab-cluster-gnmic1:7890 -getsubs
[/interfaces/interface/state/counters]
Add a gNMI target.
./cli -gnmicapi http://clab-cluster-gnmic1:7890 -addtarget -target 172.20.20.200:6030 -username admin -password admin -insecure=true
Adding device 172.20.20.200:6030
Delete a target.
./cli -gnmicapi http://clab-cluster-gnmic1:7890 -delete -target 172.20.20.200:6030
Checking for promtheus metrics.
curl clab-cluster-gnmic1:9804/metrics
Truncating a bit here for only a few metrics.
interfaces_interface_state_counters_in_broadcast_pkts{interface_name="Ethernet2",source="172.20.20.3:6030",subscription_name="sub1"} 461
interfaces_interface_state_counters_in_multicast_pkts{interface_name="Ethernet1",source="172.20.20.3:6030",subscription_name="sub1"} 530
Conclusion
It is really amazing that it took me longer to write this article and the github repo than it did for me to put together everything within gNMIC. Its really amazing that a tool like this exists in the free and open source environment for anyone to create a what I would call a production level telemetry collector as well as leverage open source tooling with it like prometheus and consul.